In this article
Why do I need a Context Graph when Claude can connect directly via MCP?
The honest answer to "why do I need FunnelStory when Claude can connect directly via MCP?" — covering token inflation, inconsistency, RBAC and blast radius, and why a context graph is what makes Claude-plus-MCP actually work at enterprise scale.

By Alok Shukla
Cofounder and CEO
Apr 20, 2026
13 min read
Last Updated: Apr 21, 2026
What actually happens when you point a model at your raw systems, why the answer looks like magic in a demo and breaks at enterprise scale, and what a context graph is really doing underneath it all.
The question that won't go away
In a webinar last week, Rod Cherkas — founder of HelloCCO and one of the sharpest minds working with Chief Customer Officers today — asked the question I've been hearing almost every week for the last six months:
"Can you explain why I'd need FunnelStory — or any context graph — rather than just connecting Claude directly to Gong, HubSpot, Zendesk, and the rest through MCP?"
It's a fair question. Claude is powerful. MCP — the Model Context Protocol — is real and genuinely useful. The marketplace of connectors is growing weekly. And if you squint at the marketing around any of this, it looks like you can wire five or six connectors together on a Friday afternoon and be done.
Let me answer it lucidly, because the answer isn't "you can't." The answer is: you can — and most teams who try will burn a meaningful amount of money, organizational trust, and engineering time discovering what a context graph actually does for them.
After the session, Russ Slaten, Chief Customer Officer at Tanium, put the dynamic to me this way:
"You probably have a much deeper answer and I get it, but there's so much vibe coding going on nowadays I think people just assume they can easily build anything with Claude."
That's exactly right, and it's worth taking seriously. The generative AI era has produced an extraordinary number of single-user, front-end-heavy demos that look like production systems. The gap between that and "my entire customer success organization runs on this every day" is enormous, and most of it is invisible until you've hit it. So let me walk through what actually happens when you try, the three specific failure modes you'll hit in the order you'll hit them, and what a context graph does that makes the Claude-plus-MCP experience actually work at enterprise scale.
Two deployments, side by side — where the work actually happens
Before the details, it helps to see the two shapes on one page. The fastest way to understand the cost, consistency, and security story is to look at where the reasoning lives in each architecture — because that single question explains almost everything else.
Without a context graph: Claude + MCP directly on raw sources
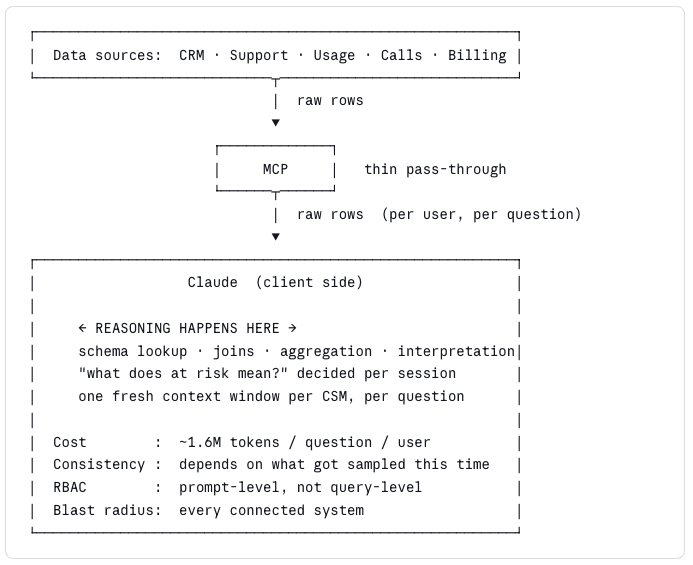
With a context graph: reasoning is centralized, Claude does judgment
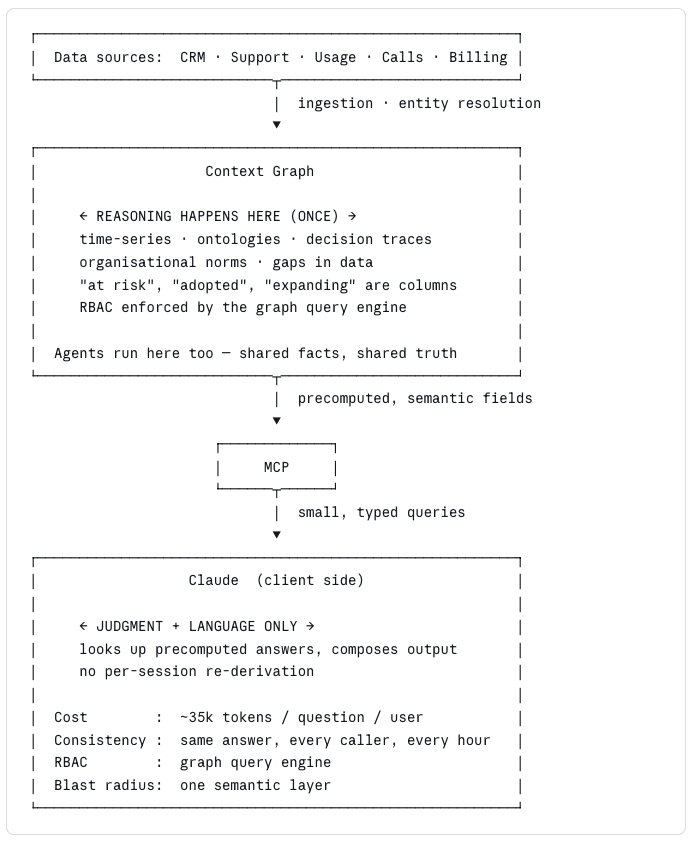
The difference between those two diagrams is the entire argument. Everything below is just the receipts.
The three things that bite you, in the order they bite
1. Token inflation will burn your AI budget faster than you expect
When you point Claude at raw sources through MCP, every question turns into a loop. Find where the data lives. Pull some of it. Read the schema and guess what columns are relevant. Decide what "at risk" means this time. Join across systems — inside the context window, with no indexes. Aggregate. Interpret. Answer. Then repeat the same exploration twenty minutes later for the next CSM who asks the same question, because the context doesn't persist and the reasoning wasn't materialized anywhere.
We benchmarked a renewal-intelligence workflow both ways. On raw data through MCP, Claude ran about 22 queries to answer one question, re-reading and re-planning between each one — roughly 1.6M tokens per run. On a pre-computed intelligence graph where the answer is already a column, it was about 9 small queries and ~35k tokens. Forty-five times less.
Scale that to a CS org of 2,000 people asking roughly once a week:
Raw path:
~3.2 billion tokens/week
Graph path:
~70 million tokens/week
That's 3.1 billion extra tokens a week — before any agents run on a schedule, before any automations fire overnight, before any dashboards refresh in the background. And it gets worse as the organization adopts AI more deeply, not better: the more people ask questions, the more the raw path loses.
This is exactly how Uber's CTO ended up publicly explaining that a full-year AI budget got consumed by April. It wasn't a fluke, and it wasn't a pricing issue. It's what happens structurally when every Claude instance redoes the analyst's work from scratch, per user, every time. A model is the wrong place to do analysis at scale — not because it can't, but because it repeats. Materialization is what makes analysis cheap; reasoning is what makes it expensive.
A context graph flips this dynamic. The hard parts — "which users map to which account across three systems," "what counts as active," "what does risk look like this week vs. a baseline" — are computed once, against the raw data, and cached as first-class fields. Claude shows up and asks a small, typed question: "give me this account's risk factors right now." A few thousand tokens, not millions. You pay for judgment, not for re-deriving the data model on every prompt.
2. Inconsistency quietly breaks the organization
This is the one people don't see coming, and the one that does the most institutional damage.
We ran the same question — "what's the health of these accounts?" — through raw-data Claude at 10 a.m., 2 p.m., and 6 p.m. We got three different answers. Not three rephrasings of the same answer. Three different conclusions about the same accounts, on the same day, with no material change in the underlying data.
Why? When the model does the analysis each time, the outcome depends on which rows it happened to sample into its context window, which joins it happened to make this run, what it prioritized when the context started to run out, and which heuristic it landed on for "health" in that particular session. Pretty output, unstable truth. Stochastic at the level that actually matters — the conclusion.
An enterprise cannot run on facts that depend on when you asked the question and who asked it. The first time a CS leader sees one answer in their dashboard at 10 a.m. and a different answer from the same tool at 4 p.m., trust collapses — and it's very hard to rebuild. People stop using the thing. Or worse, they keep using it but lose faith in the output and start hedging every decision, which defeats the point of having the system at all.
The deeper issue is that "health" isn't a property of the rows. It's a property of your organization. It's an ontology — a definition of what matters — and it needs to live somewhere that is stable, inspectable, and shared. When the model reinvents the ontology every session, your org has no shared truth. When the graph owns the ontology and the model reads from it, everyone sees the same answer. The CSM, the VP, the CFO, the QBR slide, the Slack bot. Same facts. One version of "at risk."
A pre-computed graph solves this by making the hard decisions once — what counts as a risk, what counts as adoption, which users belong to which account — and serving everyone the same materialized answer. The model then goes back to doing what it's genuinely good at: language and judgment on top of facts you already trust. That's not a small point. It's the difference between a model as a thinking tool and a model as an authoritative system of record. The former works; the latter doesn't.
3. Security and RBAC are the quiet disaster
Point Claude at raw systems and the context window becomes the wire. Rows from Salesforce, Zendesk, Slack, and your product database all land inside the model's context and get joined there — a client-side join, the pattern databases deliberately moved away from thirty years ago for a reason. Client-side joins don't just leak data accidentally. They centralize every piece of sensitive information you have into one place, the model context, which was never designed to be a security boundary.
That pattern carries two risks that don't show up in a demo:
There's no meaningful organisational RBAC. What this CSM should see vs. what that CSM should see is mediated by prompts and tool permissions, not by a query engine that understands your access model. A prompt like "only show accounts assigned to the current user" is not a permission; it's a suggestion to a stochastic text generator. That is not how access control works, and no security team will sign off on it once they understand what's actually happening under the hood.
The blast radius of one bad OAuth link, a compromised connector, or a prompt injection is your entire connected surface area. Because the model is composing answers from raw pulls across five or six systems, an attacker who compromises the model's context or any one connector has a foothold that spans everything the model can read.
That last point isn't theoretical. In the past few months alone:
Vercel (April 2026)
disclosed a breach that started when an employee connected a third-party AI tool to their corporate Google account via OAuth. The AI tool was compromised, the attacker took over the employee's Workspace account, and from there reached Vercel environments and unencrypted credentials. (TechCrunch report · Vercel's own bulletin)
Lovable (early 2026)
shipped thousands of apps with missing Row-Level-Security policies and a Broken-Object-Level-Authorization flaw. A single AI-generated app leaked data for 18,000+ users; the underlying pattern affected every project created before November 2025. (
Anthropic's own threat-intelligence report
describes banning entire accounts and operations — from data-extortion campaigns targeting 17 organizations to ransomware generation and recruitment fraud — all stemming from agent and API misuse. ( Anthropic took down the entire organization in error)
These aren't edge cases. They're the expected distribution of outcomes when raw data and raw credentials fan out to every client instance. The pattern is too productive for attackers to ignore and too common to avoid.
A context graph flips this: the model reads a semantic layer, not raw systems. RBAC is enforced by the graph's query engine — the same way your database enforces it today — so the permission check happens before the bytes ever leave the server. The blast radius of a compromised prompt or connector is narrow by construction because the model never had raw credentials or raw rows in the first place. That's not a feature. It's architecture.
What exactly is a context graph doing that Claude can't?
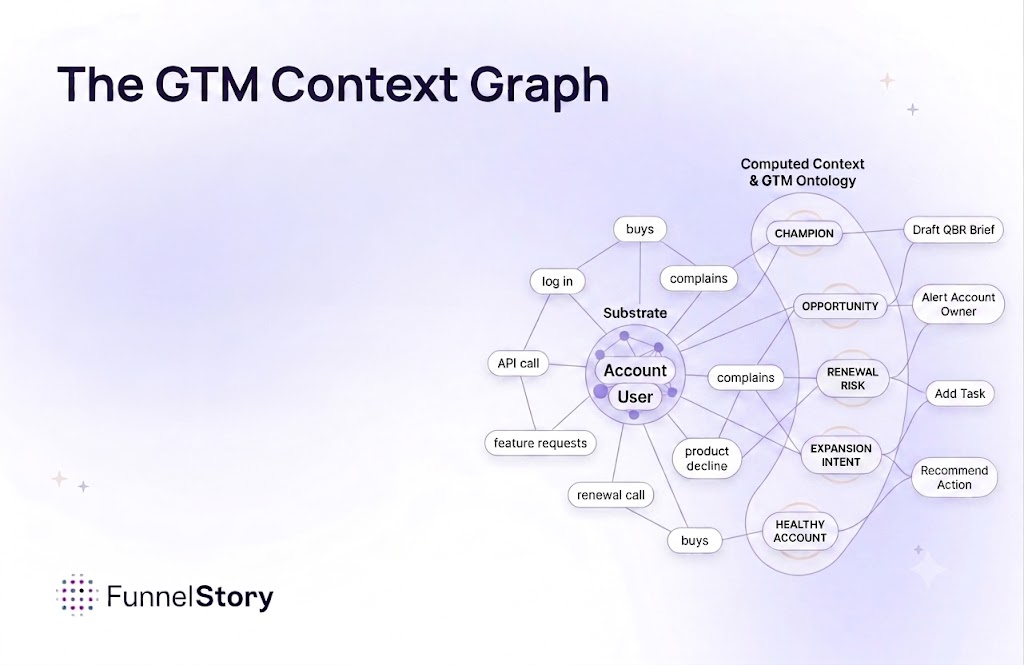
It helps to be concrete, because "context graph" can sound like a buzzword if you haven't seen one up close. Here's what actually lives inside it, in plain terms.
Entity resolution across systems. Your CRM has a concept of "Account." Your support tool has "Organization." Your billing system has "Customer." Your product has "Workspace." These are almost — but not quite — the same thing. Resolving them correctly, at scale, as they drift over time, is the kind of work that looks trivial on a whiteboard and is extremely non-trivial in production. The graph does this once, continuously, and the rest of the system gets to treat "Account" as a real thing rather than an ambiguous shape it has to re-derive every session.
Time-series state. Everything that matters in customer success is a trajectory, not a snapshot. "Adoption dropped 22% over the last three weeks" is a fact; "adoption = 78%" is a frozen cross-section that tells you almost nothing. The graph stores history natively, so when Claude asks "what's going on with this account this month?" it gets back a motion picture, not a photograph.
Ontologies — your organisation's definitions. What counts as "at risk" at your company is not what counts as "at risk" at another. It's a combination of usage drops, support escalations, champion movement, billing anomalies, and things you've learned the hard way over the last five renewal cycles. That specific combination is an asset. It belongs in a layer that is inspectable, versionable, and enforceable — not re-hallucinated by a model every session.
Decision traces. When the graph says an account is at risk, it can say why — which signals fired, in what order, against what baseline. That traceability is what makes the output auditable and actionable, and it's something no amount of prompt engineering against raw data can reliably produce.
Gaps in data, made explicit. Enterprise data is full of holes — missing fields, stale joins, events that never landed. The graph represents those gaps as first-class. Claude can then say honestly, "I don't know, and here's why." Raw-data Claude doesn't know what it doesn't know, so it confidently extrapolates. That's a very expensive kind of wrong.
A home for agents. This is the piece most teams underestimate. Long-running agents — the ones that watch accounts, escalate, draft emails, update records — cannot operate on facts that shift between instances. They need one version of the truth, updated continuously, with history. That's a graph. Agents are not on top of the graph; they live in it.
"But can't I just build this with Claude?"
This is the second half of the question, and the one I want to answer carefully — because yes, someone can build it. A lot of people are going to try. Some will do an admirable job of it. Most will underestimate what they're taking on.
Here's the part the vibe-coding boom hides. Roughly 99% of what's being built with Claude today is a single-user, front-end-heavy application. That's where Claude is spectacular, and deservedly so. Building a context graph is a different category of work entirely: multi-source ingestion, entity resolution across systems, time-series relationship modeling, derived-field materialization, RBAC enforcement in the query layer, schema drift management, incremental reprocessing, and the ontologies that encode how your organisation defines things like "at risk" or "adopted."
That's backend and infrastructure work. Multiple moving parts have to stay correct together, over time, as schemas drift and products evolve and definitions shift and people leave the team. It is exponentially harder than building the UX on top of it — with or without Claude's help. And unlike a front-end, it doesn't have a "pretty enough to ship" state. It's either correct or it's silently lying to you, and the cost of the latter is very high and shows up slowly.
Two honest datapoints from my own experience, anonymised.
Earlier this year I was at the last round of an evaluation at a large developer-platform company. Their own IT team stopped the project and told the sponsor, "you can't build this yourself." Three months later, every concern I'd raised had come true for them — token spend out of control, inconsistent answers across teams, and a security incident that made them pause the entire initiative.
On the other side of the ledger, I closed a different evaluation at a security vendor because they'd concluded — from their own internal pilot — that the Claude-direct-to-data approach was unreliable and decided not to proceed at all. It wasn't a sale I won on a demo. It was a sale I didn't lose because reality caught up.
Both outcomes are about the same thing: customers parse hype vs. reality through their own experience. I respect that, and I expect it. It's also why I don't spend much time telling people they can't build this themselves — I spend time helping them understand what they'd actually be signing up for if they did.
Claude + MCP + a context graph — not Claude vs. a context graph
The framing I'd push back on is "Claude or FunnelStory." That's not the choice, and it was never the choice. The real choice is Claude with a context graph underneath, or Claude without one.
A context graph — time-series, with decision traces, precomputed intelligence, organisational norms, and even the gaps in your data made explicit — is what makes the Claude-plus-MCP experience actually work at enterprise scale.
Cheaper. About 45× fewer tokens in our benchmarks. The economics of AI at scale are the economics of
not re-deriving the data model on every prompt.
Faster. Lookups against precomputed fields instead of multi-step reasoning across raw tables. Users feel this in a way they never have to explain.
Consistent. One answer for everyone, every hour. The trust compounds rather than erodes.
Securable. RBAC where it belongs — in the query layer of the graph — rather than in a prompt and a hope.
Agent-ready. Long-running agents cannot operate on facts that shift between instances. A graph gives them a stable world to reason about.
Claude and MCP stay useful. They stay extraordinary. The win is to stop fanning them out to every system and instead attach those systems to one intelligence layer that gets handed to Claude as context. That's the boring engineering truth behind the magic most people see in the demos, and it's the architecture every serious AI deployment converges on eventually — the only question is whether you pay for that lesson yourself or adopt a system that already learned it.
And it's why the honest answer to "why not just Claude?" is simple: you absolutely can use Claude — you just shouldn't use it alone.